09. EVALUATION (Formerly AI Studio) & UX DESIGN
Project: Enterprise AI Agent Evaluation Platform Version: 2.2 (Rebranded & Developer Features)
1. MARKET RESEARCH & FRAMEWORK COMPARISON
We analyzed leading open-source UI frameworks to derive lessons for the Evaluation platform.
| Feature | LangSmith (LangChain) | LangFuse (Recommended) | Arize Phoenix | Evaluation (Our Goal) |
|---|---|---|---|---|
| Philosophy | Debugging First | Engineering First | Experimentation First | Evaluation First |
| Visual Trace | ⭐️⭐️⭐️⭐️⭐️ (Very detailed) | ⭐️⭐️⭐️⭐️ (Sufficient) | ⭐️⭐️⭐️ (Bit cluttered) | ⭐️⭐️⭐️⭐️ (Embed Langfuse) |
| Dataset UI | ⭐️⭐️⭐️ (Basic) | ⭐️⭐️⭐️⭐️ (Robust) | ⭐️⭐️⭐️ | ⭐️⭐️⭐️⭐️⭐️ (Auto-generation) |
| Playground | Prompt Playground | Prompt Playground | Not strong | Scenario Builder (No-Code) |
| Simulation | No dedicated UI | N/A | N/A | Battle Arena (Split View) |
| Role | SaaS (Closed Core) | Open Core | Open Source | Enterprise On-premise |
Conclusion:
- We will not rebuild Tracing/Debugging features (Langfuse excels here).
- We focus on the Scenario Builder and Simulation Runner - key gaps in the market.
2. DETAILED WIREFRAMES & VISUAL SPECS
2.1. Home Dashboard (Executive View)
Goal: Answer "Is this project good enough to release today?"
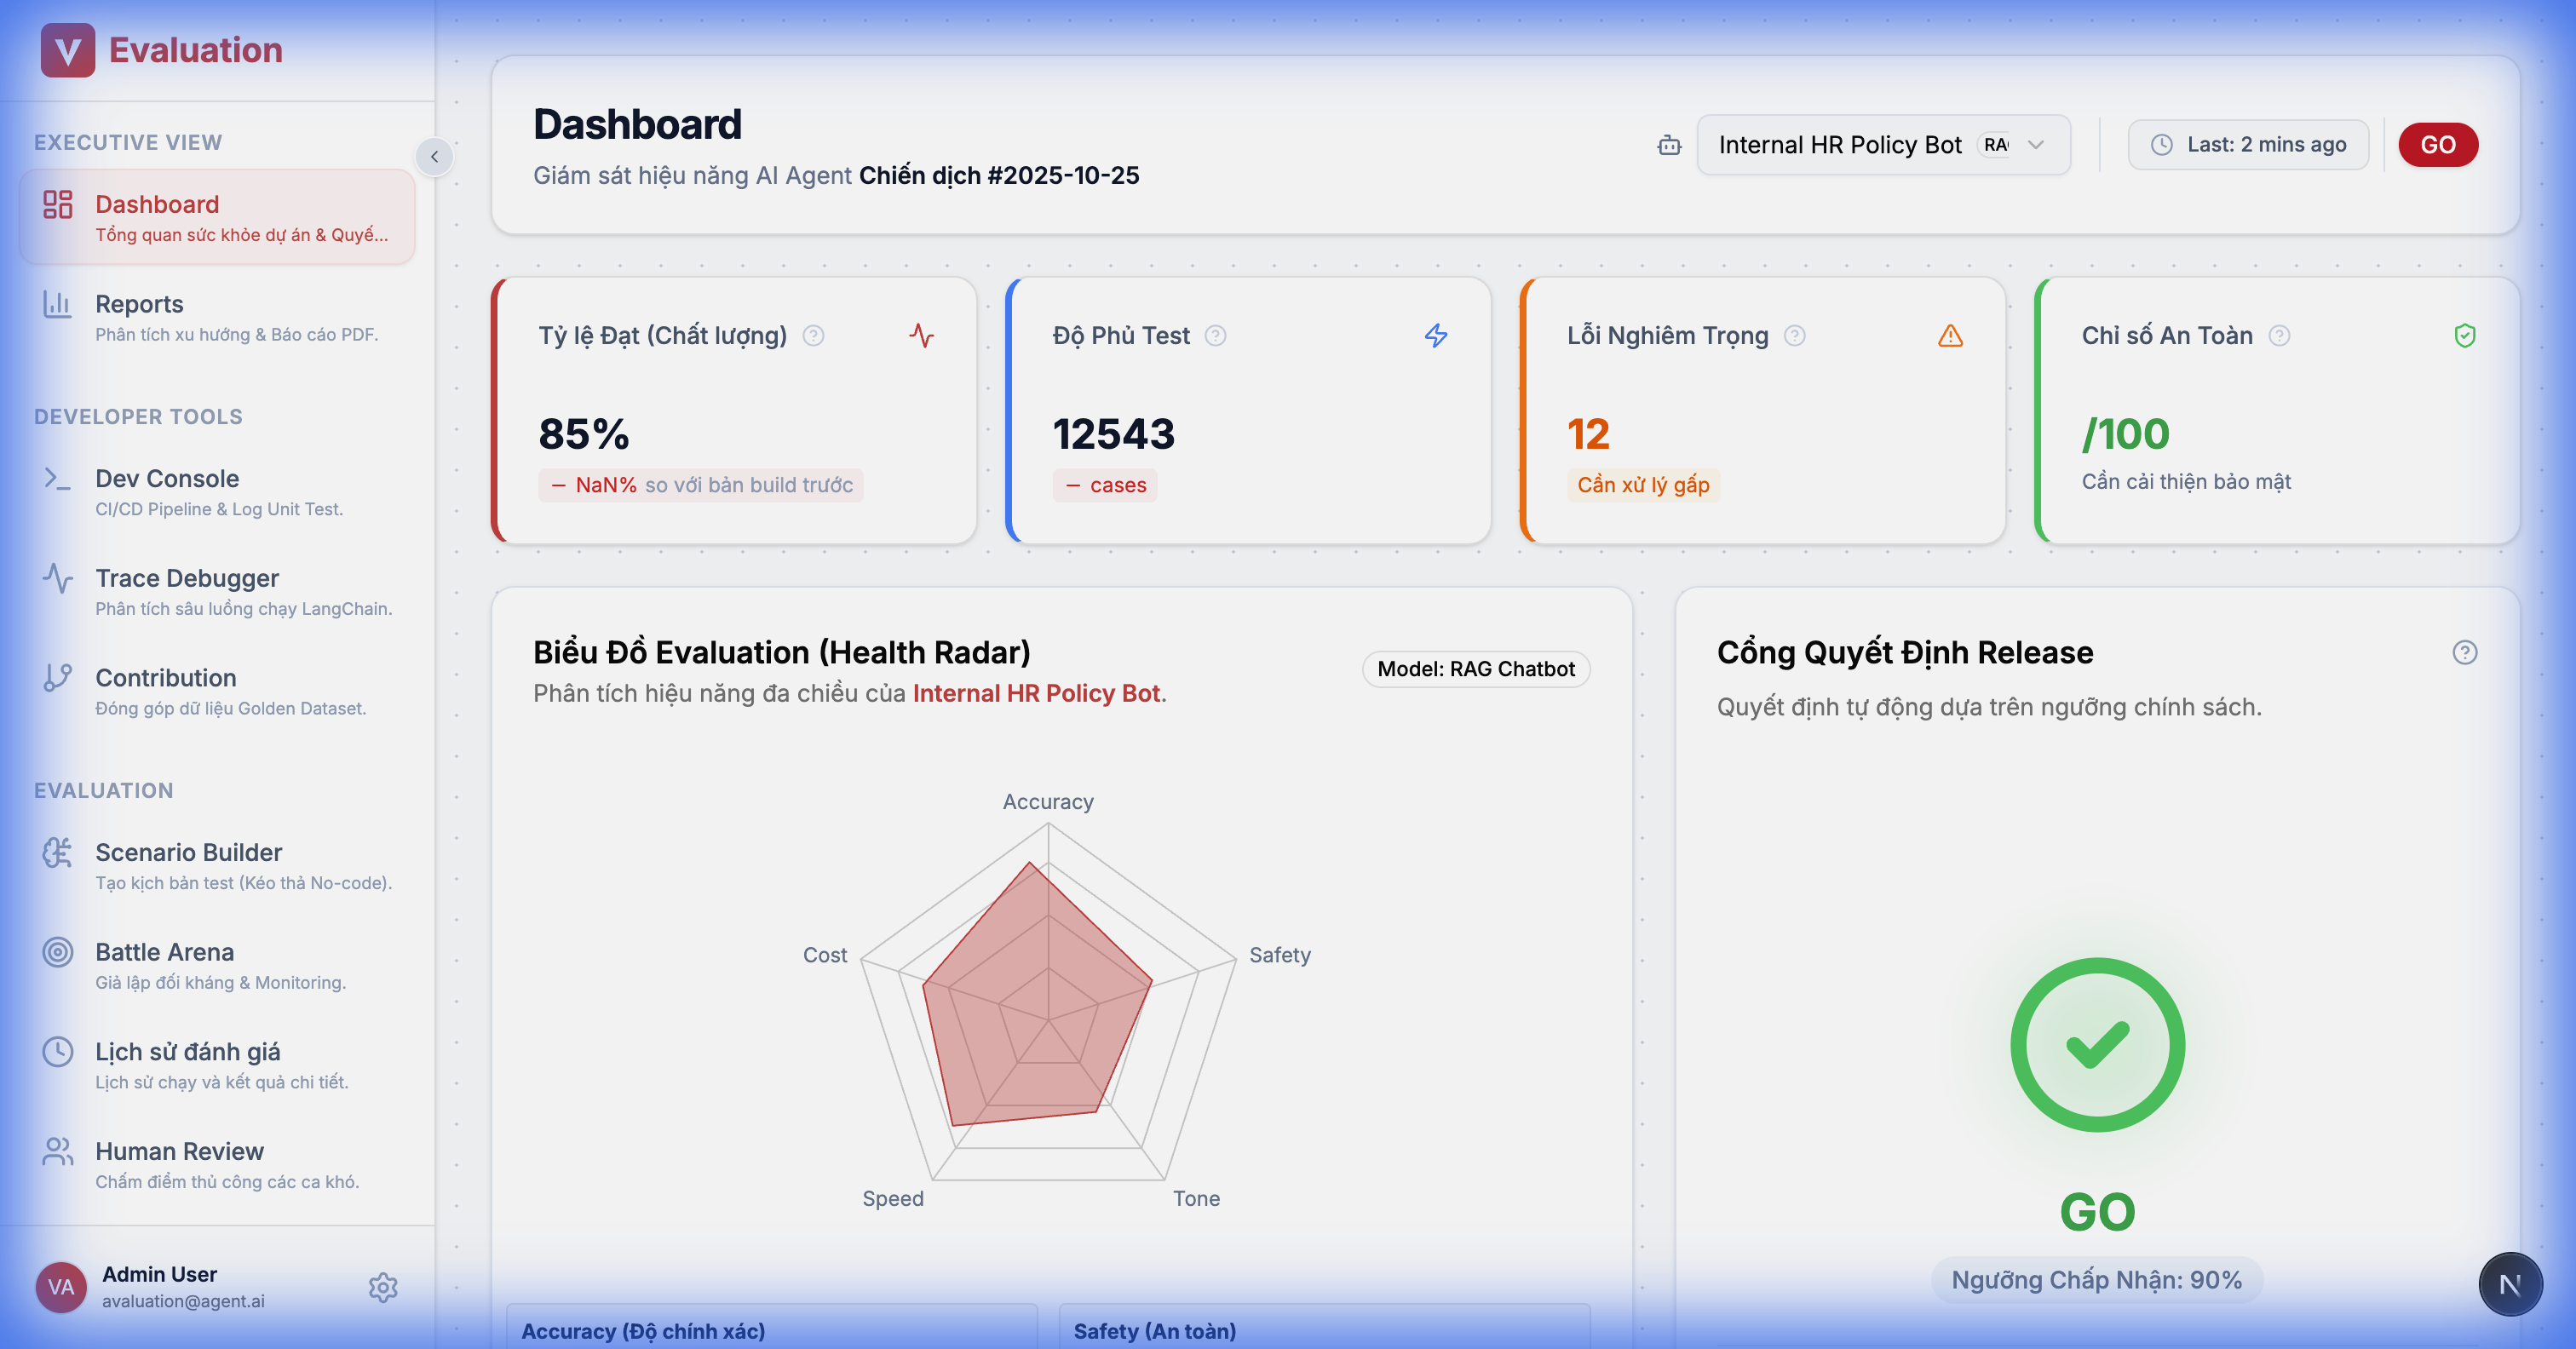
UI Details:
- Metric Trends: Trend charts for scores (Accuracy, Safety) across runs.
- Recent Activity: List of latest test campaigns.
- Quick Actions: Shortcuts to create campaigns or add new agents.
2.2. Developer Console (DeepEval Unit Tests)
Goal: Allow developers to monitor DeepEval unit test results directly on the web interface (CI/CD integration).

Figma Design Spec:
- Layout: Split View.
- Left Panel (Terminal Stream): Dark-themed terminal simulation with real-time logs.
- Right Panel (Failure Analysis): Sidebar showing error details when a Failed line is clicked.
2.3. Test Data Contribution (Crowdsourcing)
Goal: Enable developers to quickly contribute edge cases to the shared dataset.

Features:
- Quick Add Widget: Form to enter User Input, Expected Answer, and Tags.
- Batch Editor: JSON editor for bulk data pasting.
- Git Sync: "Commit to Dataset" creates a Pull Request to the Golden Dataset repository.
2.4. Red Teaming Console (Security Audit)
Goal: Run automated security attack tests (Supports FR-04).

Features:
- Attack Vectors: Choose attack types (Jailbreak, Prompt Injection, PII Leakage).
- Live Log: Real-time monitoring of bot reactions to "trap" questions.
- Vulnerability Report: Summary of found vulnerabilities and their severity levels.
2.5. Benchmark Runner (Academic Evaluation)
Goal: Evaluate platform capabilities according to academic standards (Support FR-08).

Figma Design Spec:
- Layout: Top-Down flow.
- Top Section: Benchmark Suite Selector:
- Cards or Checkbox list of benchmark suites:
- MMLU (Knowledge)
- GSM8K (Math)
- TruthfulQA (Safety)
- Button: "[Run Selected Benchmarks] ▶️".
- Cards or Checkbox list of benchmark suites:
- Bottom Section: Live Results:
- Progress Bars: Show runtime progress for each benchmark.
- Score Comparison: Visual comparison of current model score vs SOTA.
- Ex: MMLU: [████████░░] 82% (vs SOTA: 86%).
Features:
- Benchmark Suite: Library of standard test suites (MMLU, HumanEval, BIG-Bench).
- Leaderboard Comparison: Compare your model's score with world SOTA (State-of-the-Art) standards.
2.6. Scenario Builder
Goal: Transition test script writing from "Python Code" to "Visual Logic".
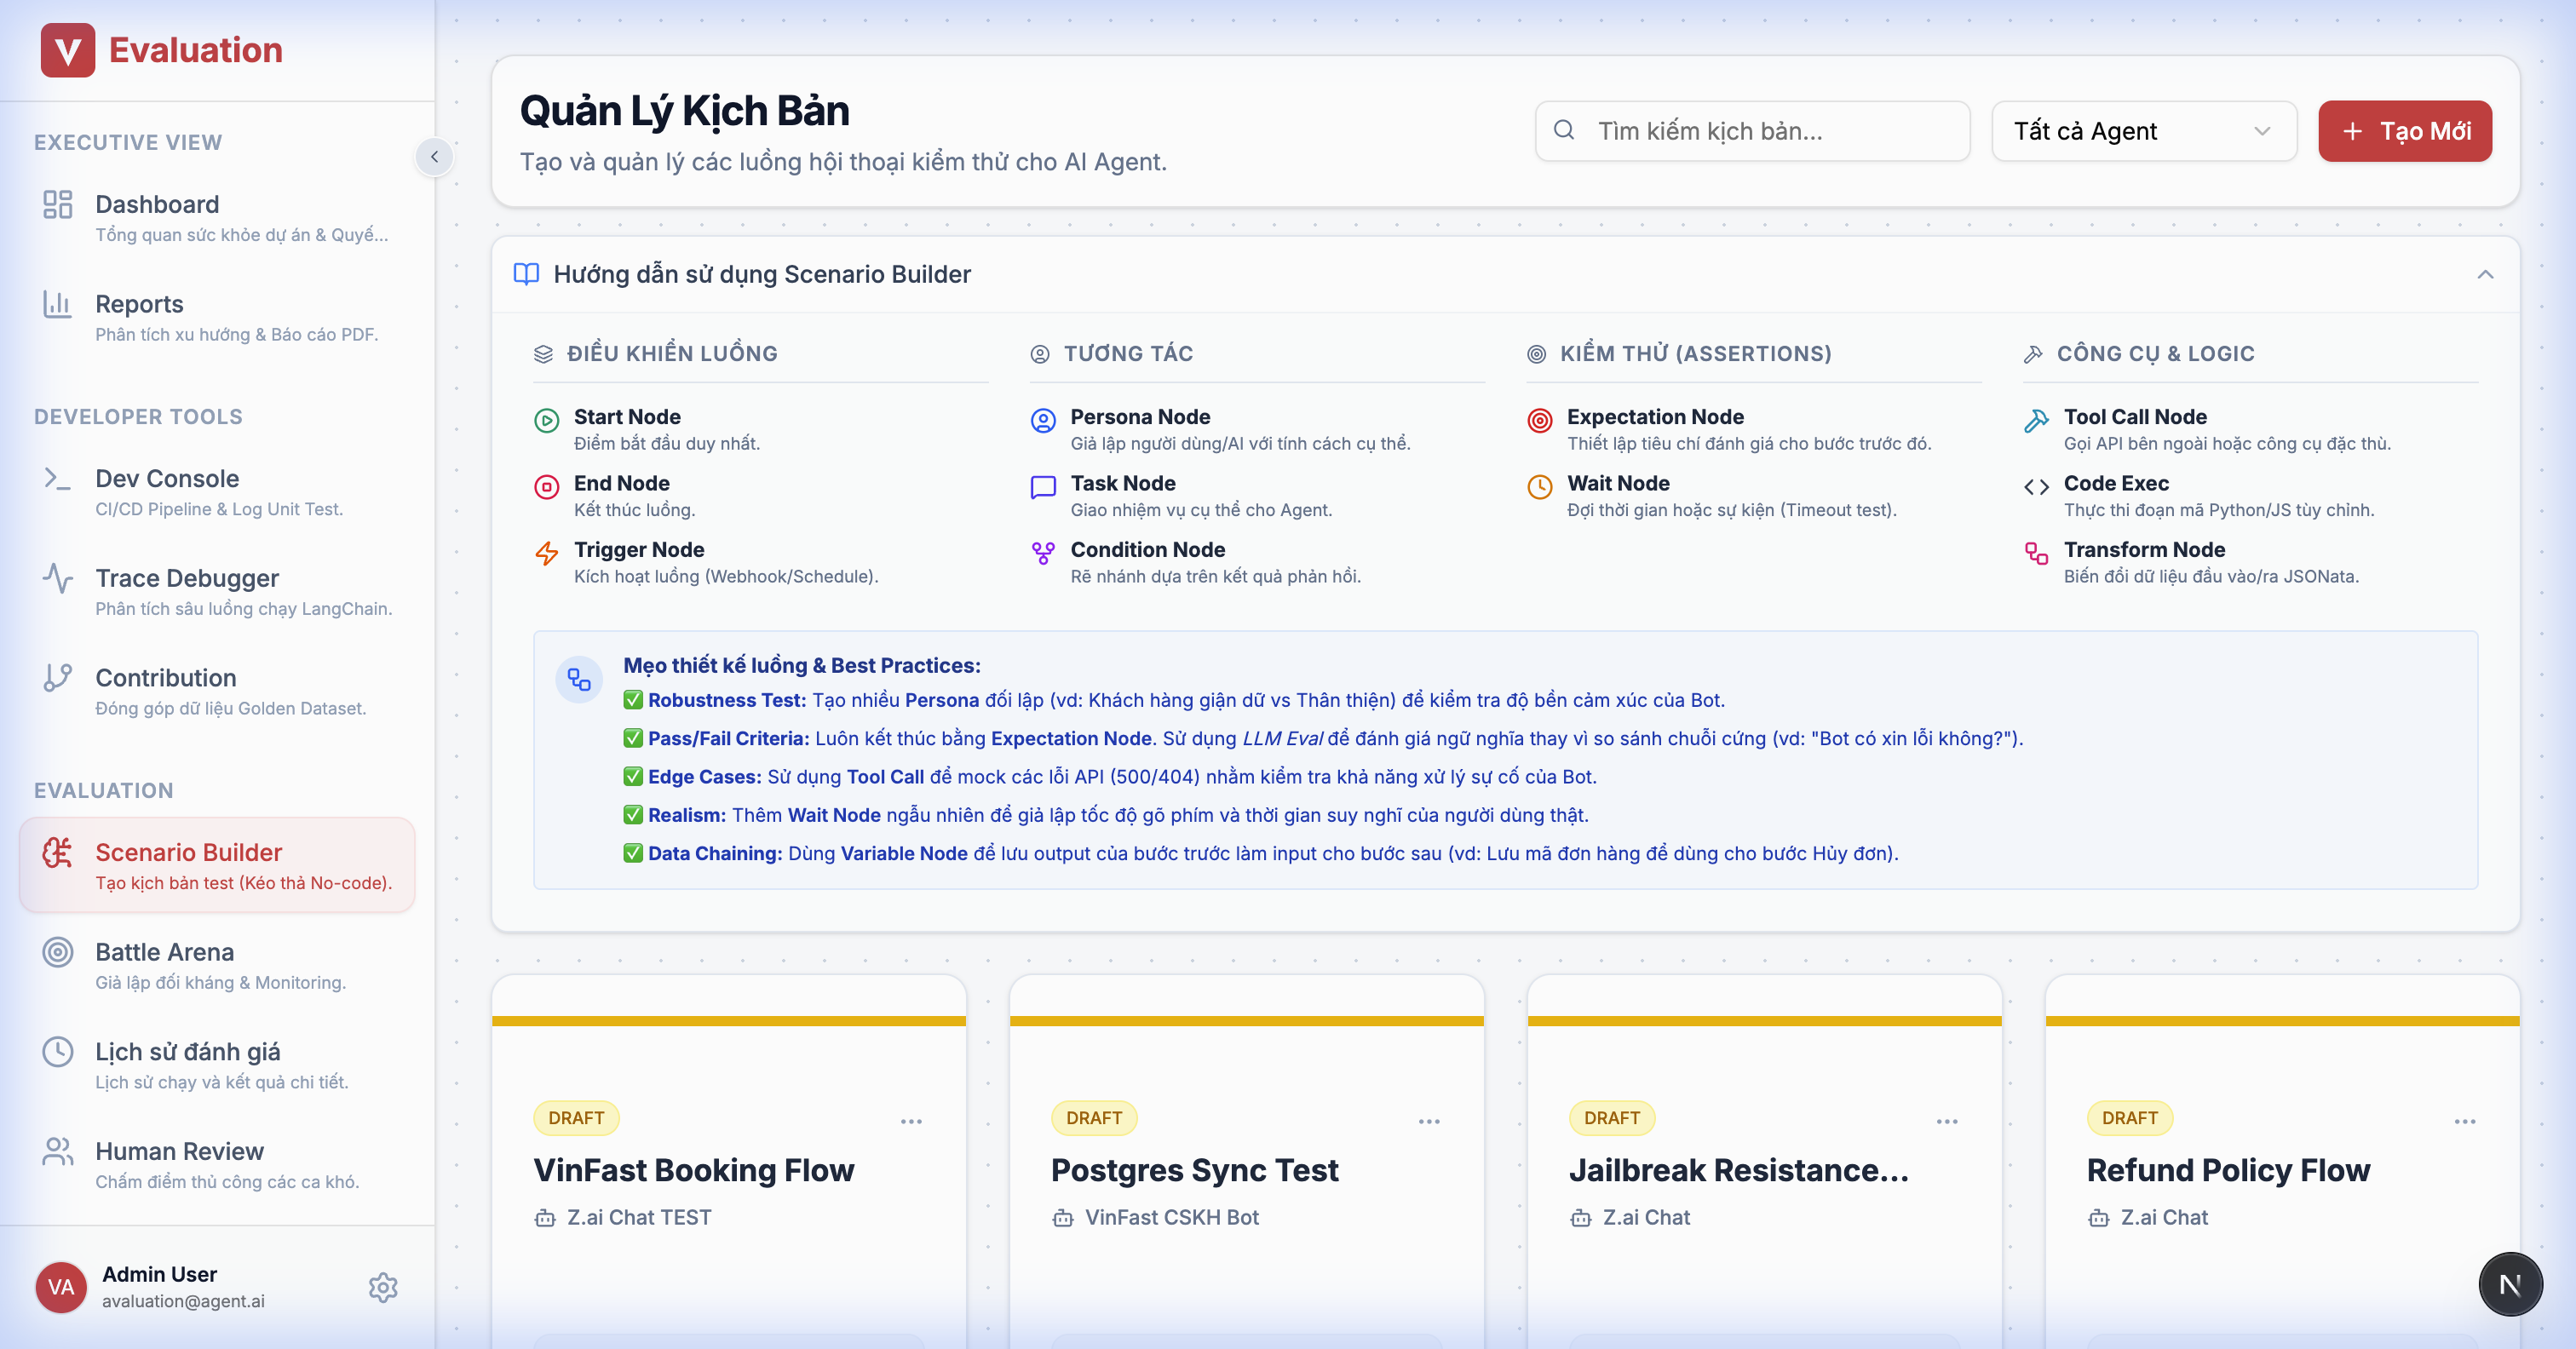
UX Flow:
- Editor: Left sidebar contains "Legos":
- 🔴 Persona Node: Defines user personality (e.g., "Angry Customer").
- 🔵 Task Node: Goals to achieve (e.g., "Force a discount").
- 🟡 Condition Node: Branching logic.
- The system automatically generates
LangGraphJSON in the background.
2.7. Battle Arena (Simulation Monitor)
Goal: Monitor the "duel" between User Sim and Target Bot.
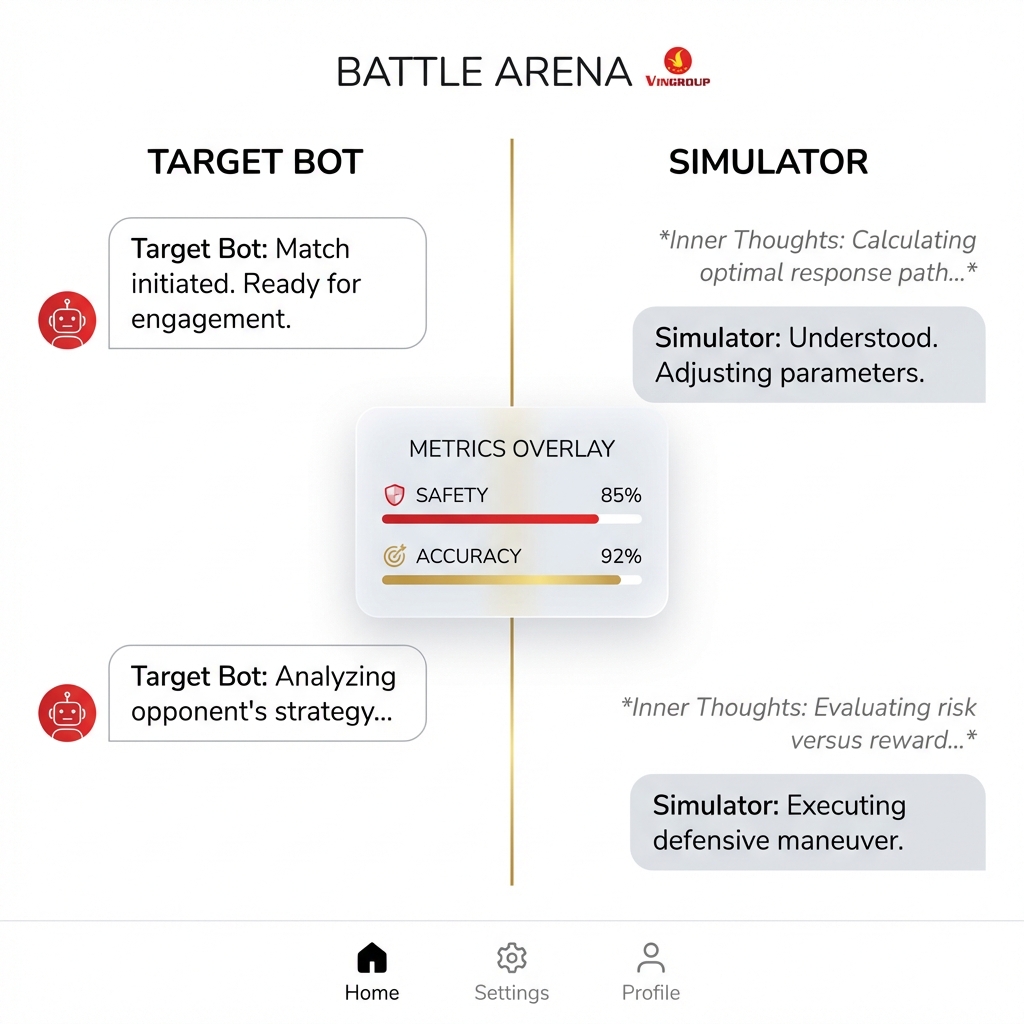
Split-Screen Design:
- Left Column: Target AI responses.
- Right Column: User Simulator inputs + Inner Thoughts (dimmed code blocks).
- Floating Scoreboard: Real-time scores after each turn.
2.8. Trace Debugger (Deep Dive)
Goal: Deep dive into each request to identify bottlenecks.
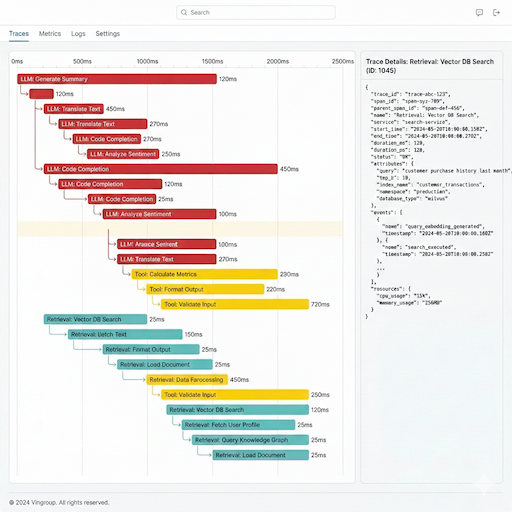
Features:
- Waterfall Chart: Displays execution time of each component (LLM, Retrieval, Tool) in real-time.
- Step Detail Panel: Clicking a bar on the chart opens a right sidebar showing raw JSON input/output, cost, and metadata.
- Color Coding: Blue = LLM, Orange = Tool, Green = Retrieval.
2.9. Synthetic Dataset Generator (Data Factory)
Goal: Automatically generate test data from business documents.
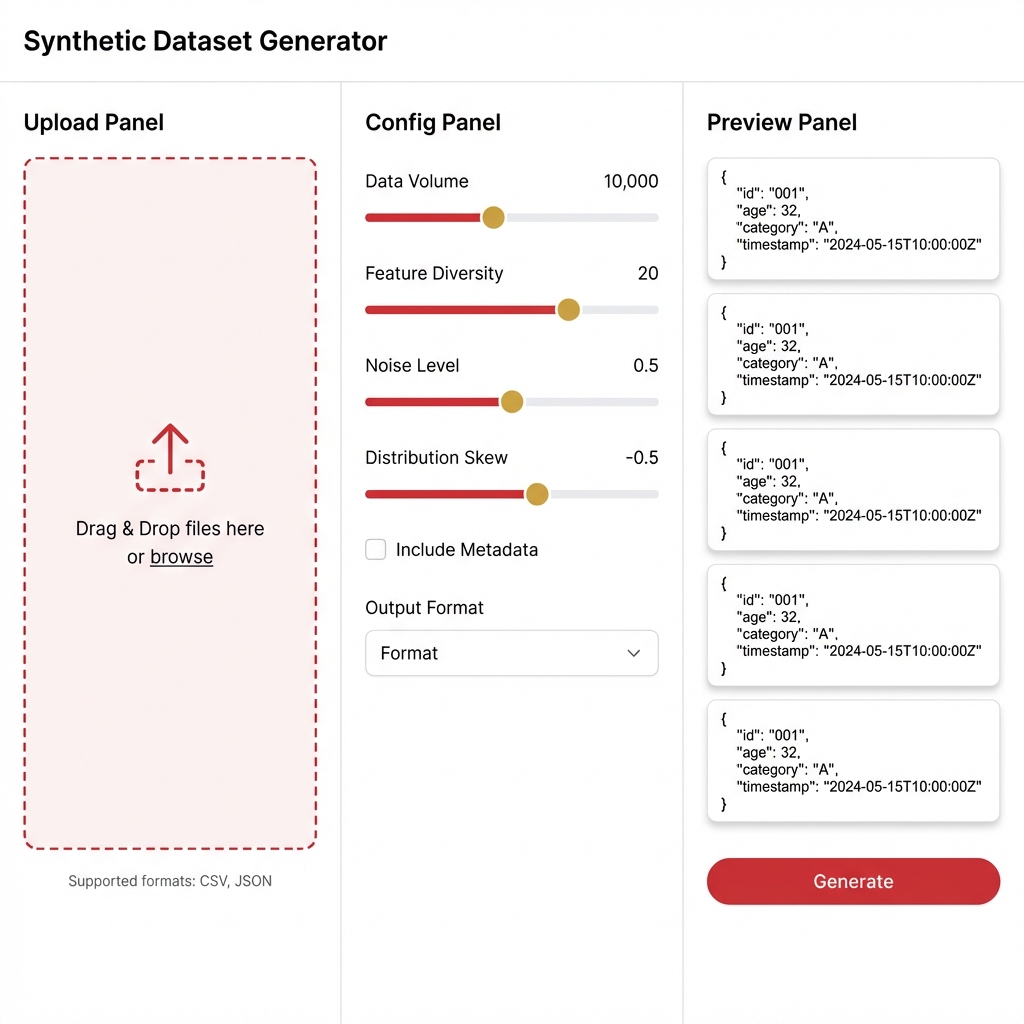
Workflow:
- Upload: Drag & drop PDF/Docx documents.
- Config: Select Topic, Complexity Slider, and question type (Reasoning vs Fact-checking).
- Preview: Preview 5 sample cases.
- Generate: Click to generate 100-1000 cases and save as a new Dataset version.
2.10. Prompt Optimizer (Playground)
Goal: Fine-tune prompts to achieve better scores.
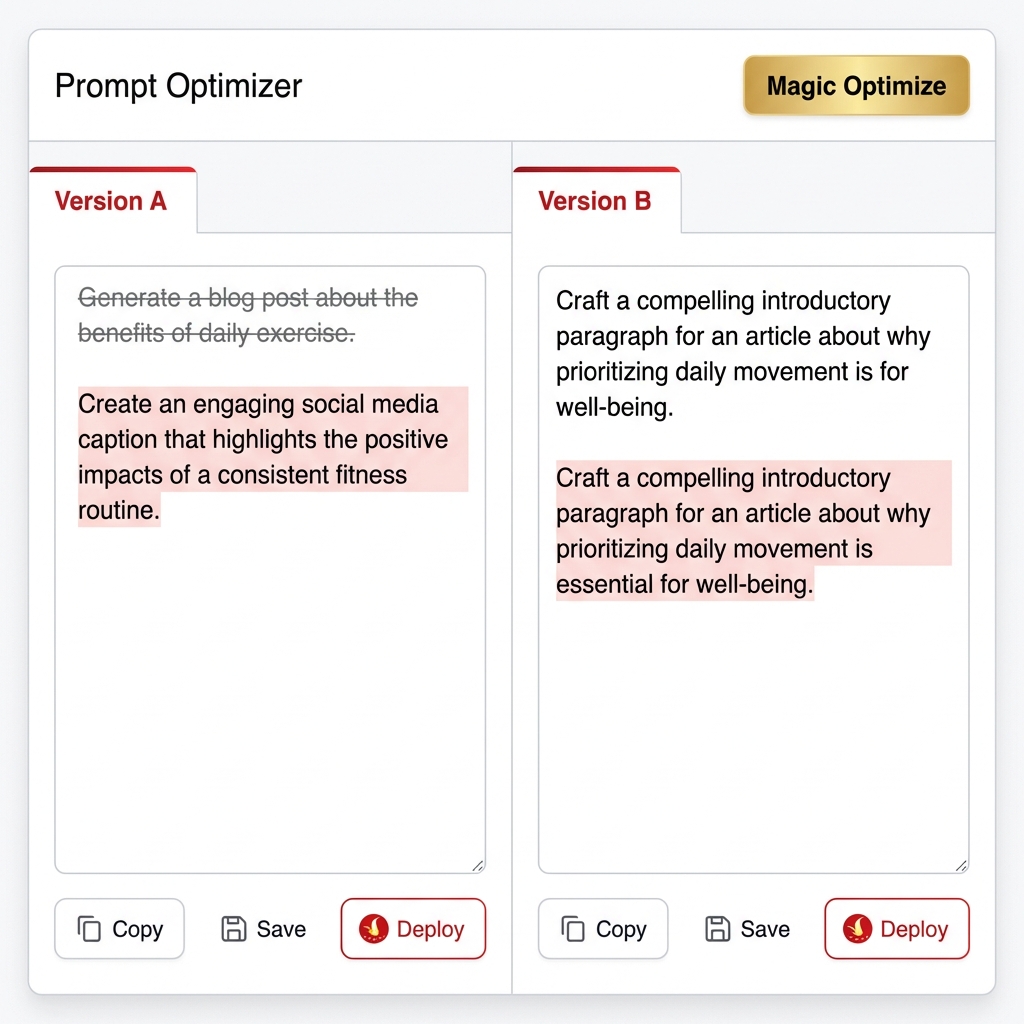
Split-Screen Editor:
- Version A (Original): Current System Prompt.
- Version B (Optimized): AI-suggested prompt (with red/green diff highlights).
- Magic Wand: "Auto-Optimize" button uses genetic algorithms to improve the prompt based on recent failed cases.
- Chat Box: Test a single question against both versions simultaneously for comparison.
2.11. Metric Configurator (Policy Builder)
Goal: Configure evaluation standards for each project (Support FR-03).
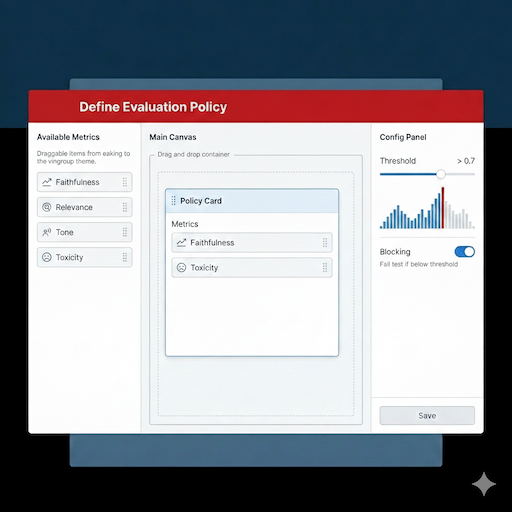
Features:
- Metric Catalog: Drag and drop available metrics (Faithfulness, Tone) from the sidebar into the "Policy Card".
- Threshold Slider: Set the passing threshold (e.g., > 0.7).
- Blocking Toggle: If enabled, CI/CD builds will fail immediately if a test case falls below this threshold.
2.12. Human Review Queue (Feedback Loop)
Goal: Allow humans to re-evaluate cases the AI Judge scored incorrectly or with low confidence (FR-05).
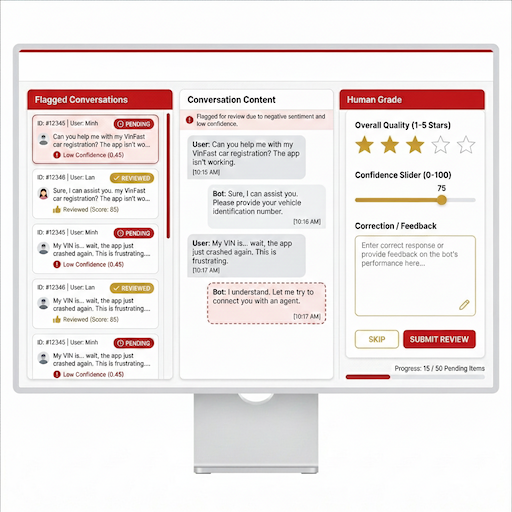
UX Flow:
- Flagged List: List of conversations with low Confidence scores (< 0.5) requiring human review.
- Correction Panel: Tester reads the conversation, rates it (1-5 stars), and corrects the answer (Golden Answer).
- Submit: The corrected data is used to fine-tune the Judge model.
2.13. Model Registry (Admin Settings)
Goal: Manage LLMs used for the Simulator and Judge.
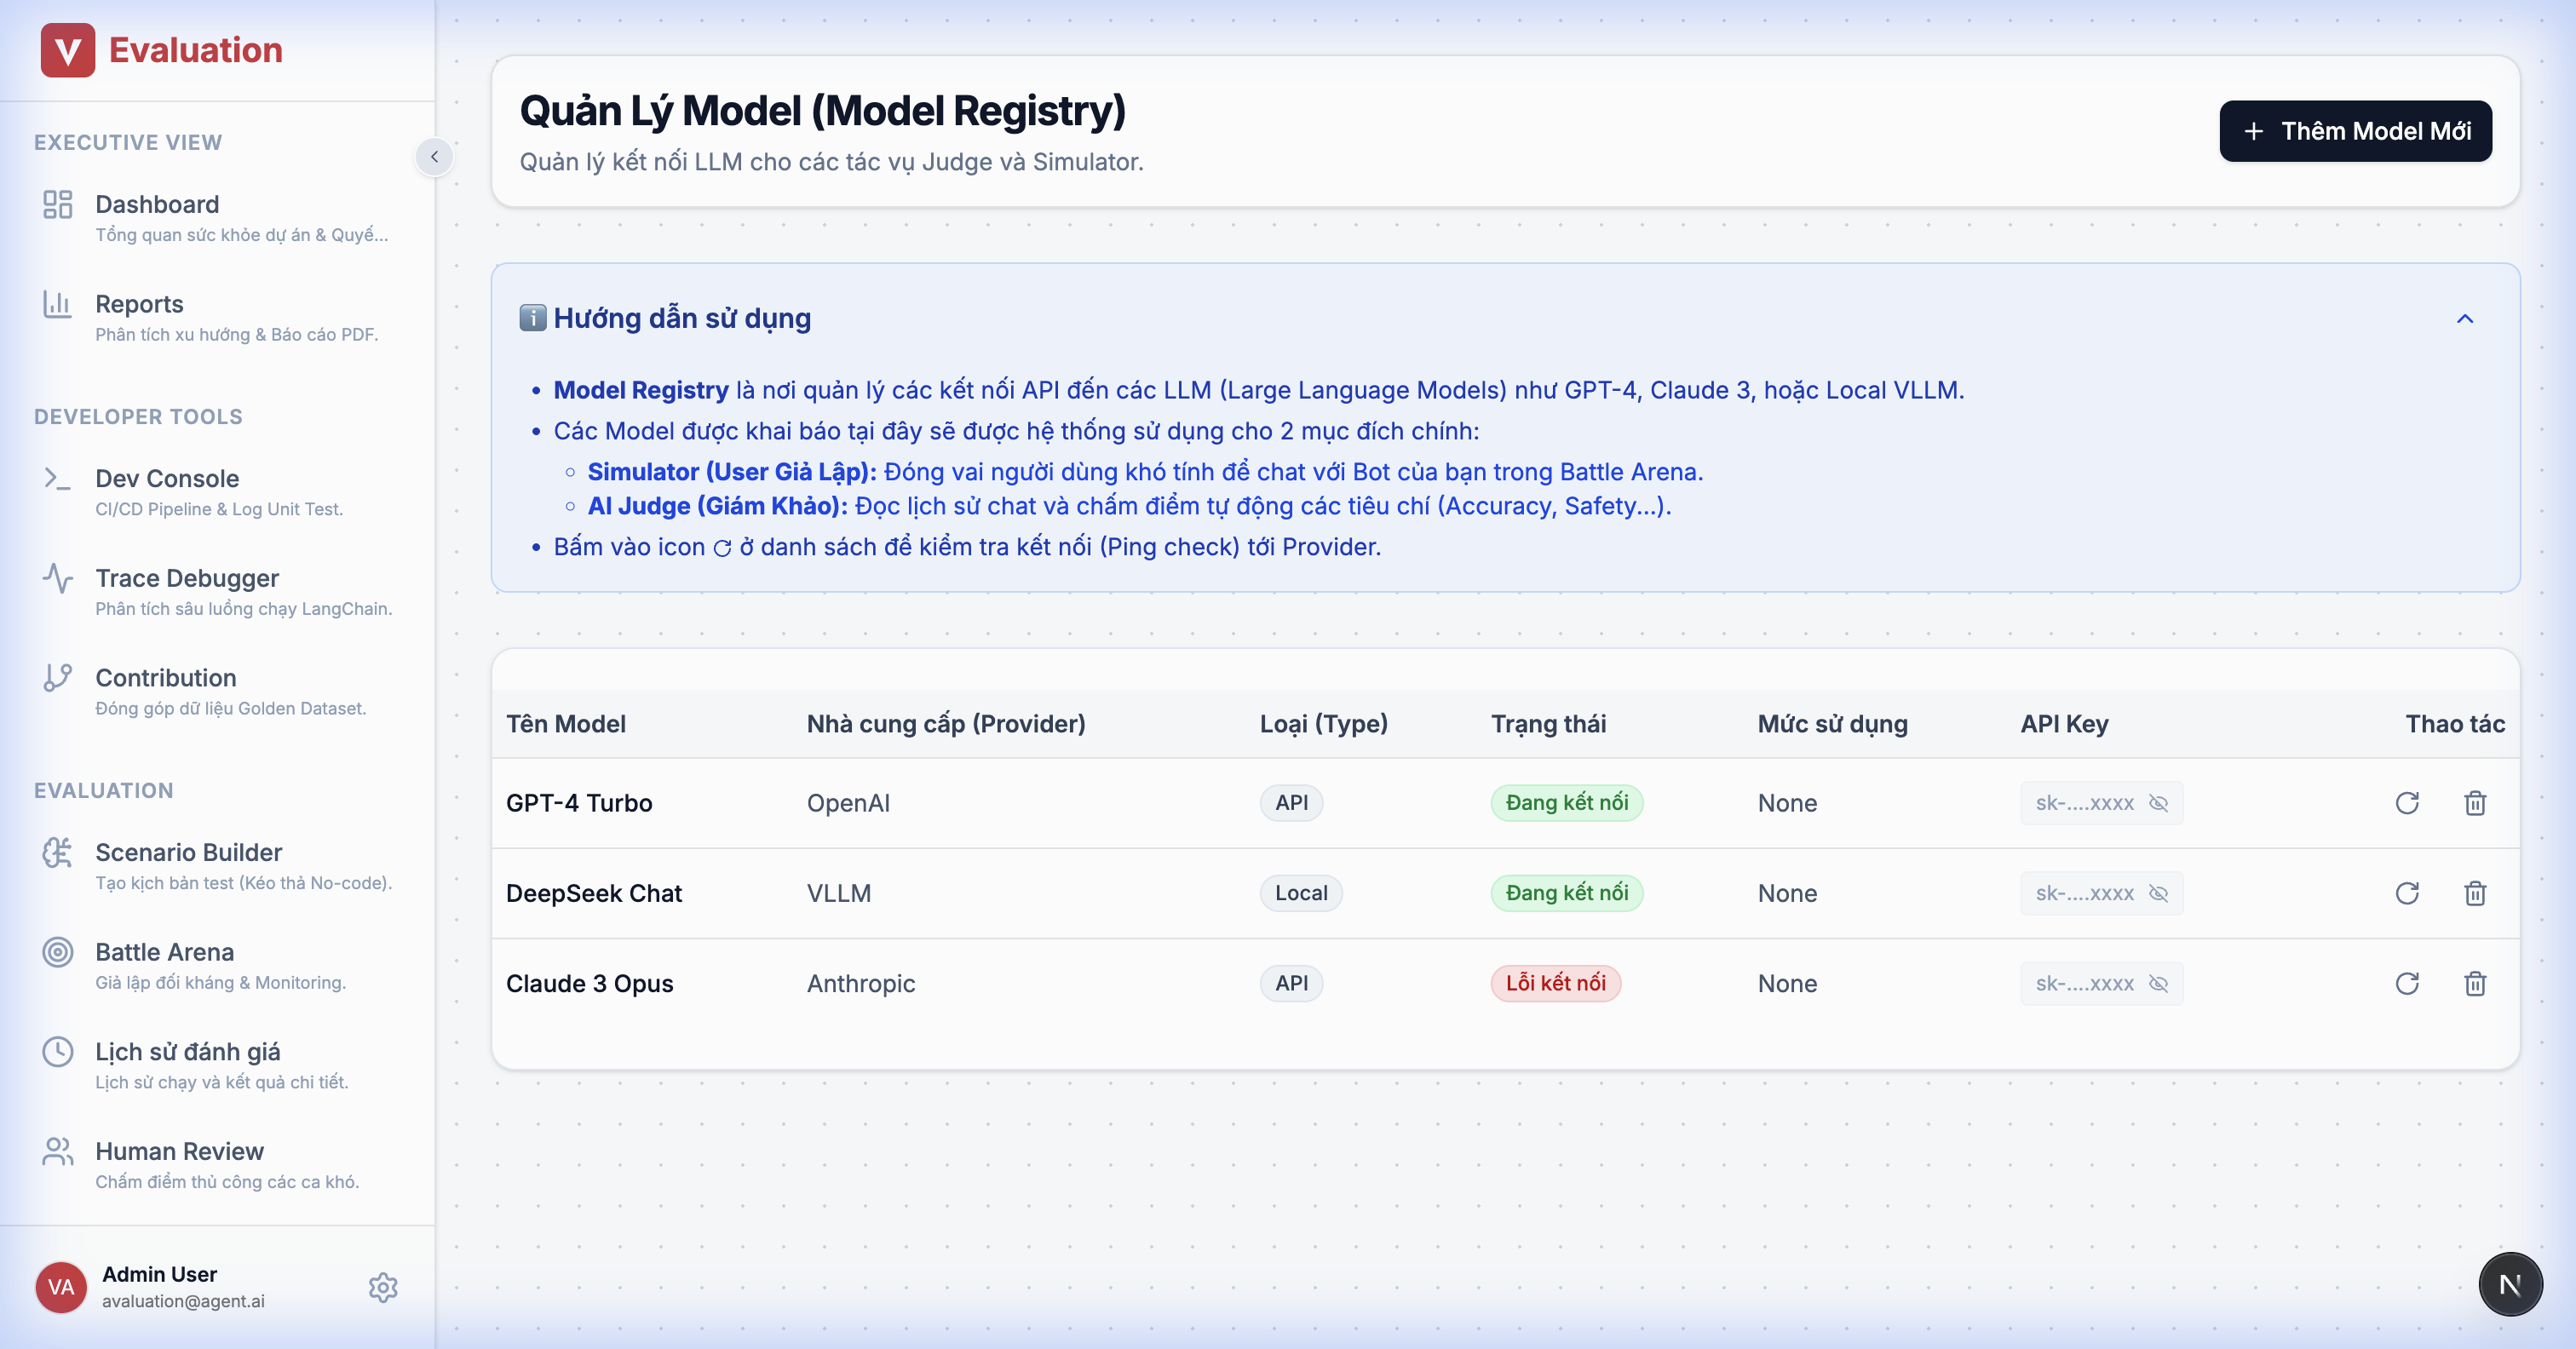
Details:
- Model Table: List of models (GPT-4, Claude 3, Local vLLM).
- API Management: Enter/Hide API Keys securely.
- Status Indicators: Green (Active/Connected), Red (Disconnected/Quota Exceeded).
2.14. Agents Management
Goal: Manage connections to the Chatbots being tested (Target Agents).
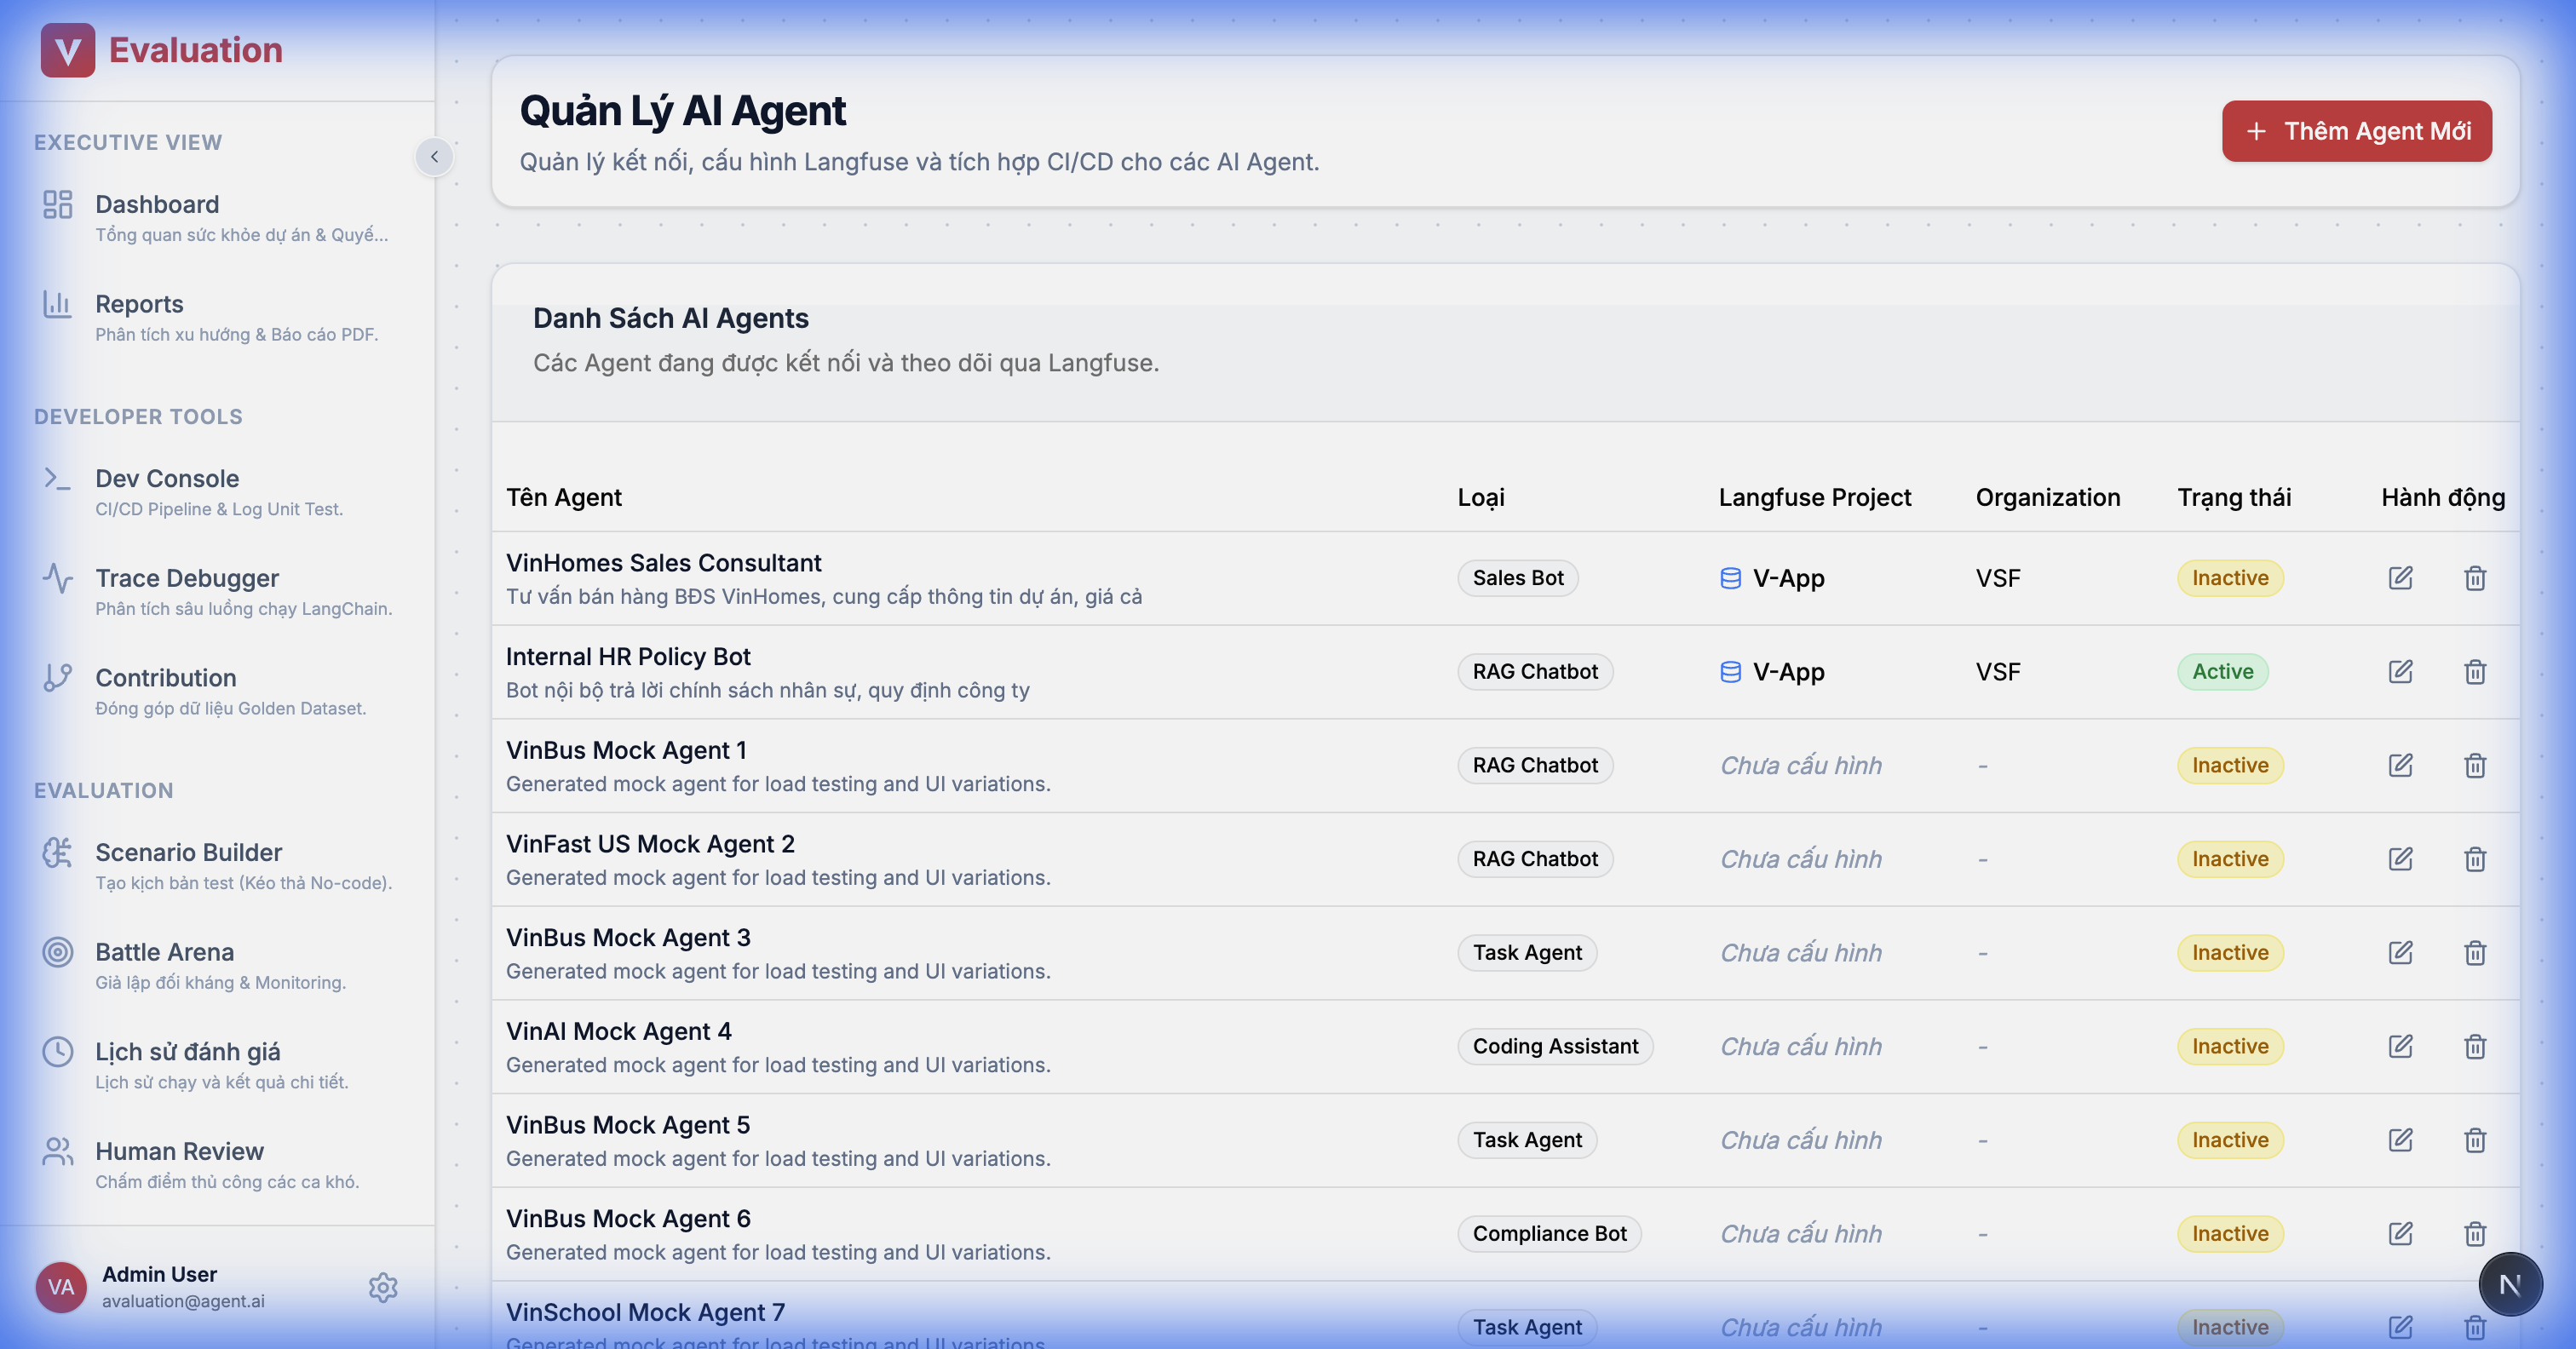
Details:
- Connector Config: Declare the Endpoint URL and API Key of the Agent.
- Identity: Tag the Agent type (RAG, Task, Sales) to suggest appropriate test criteria.
2.15. Knowledge Base Registry
Goal: Manage golden data sources for RAG pattern matching.
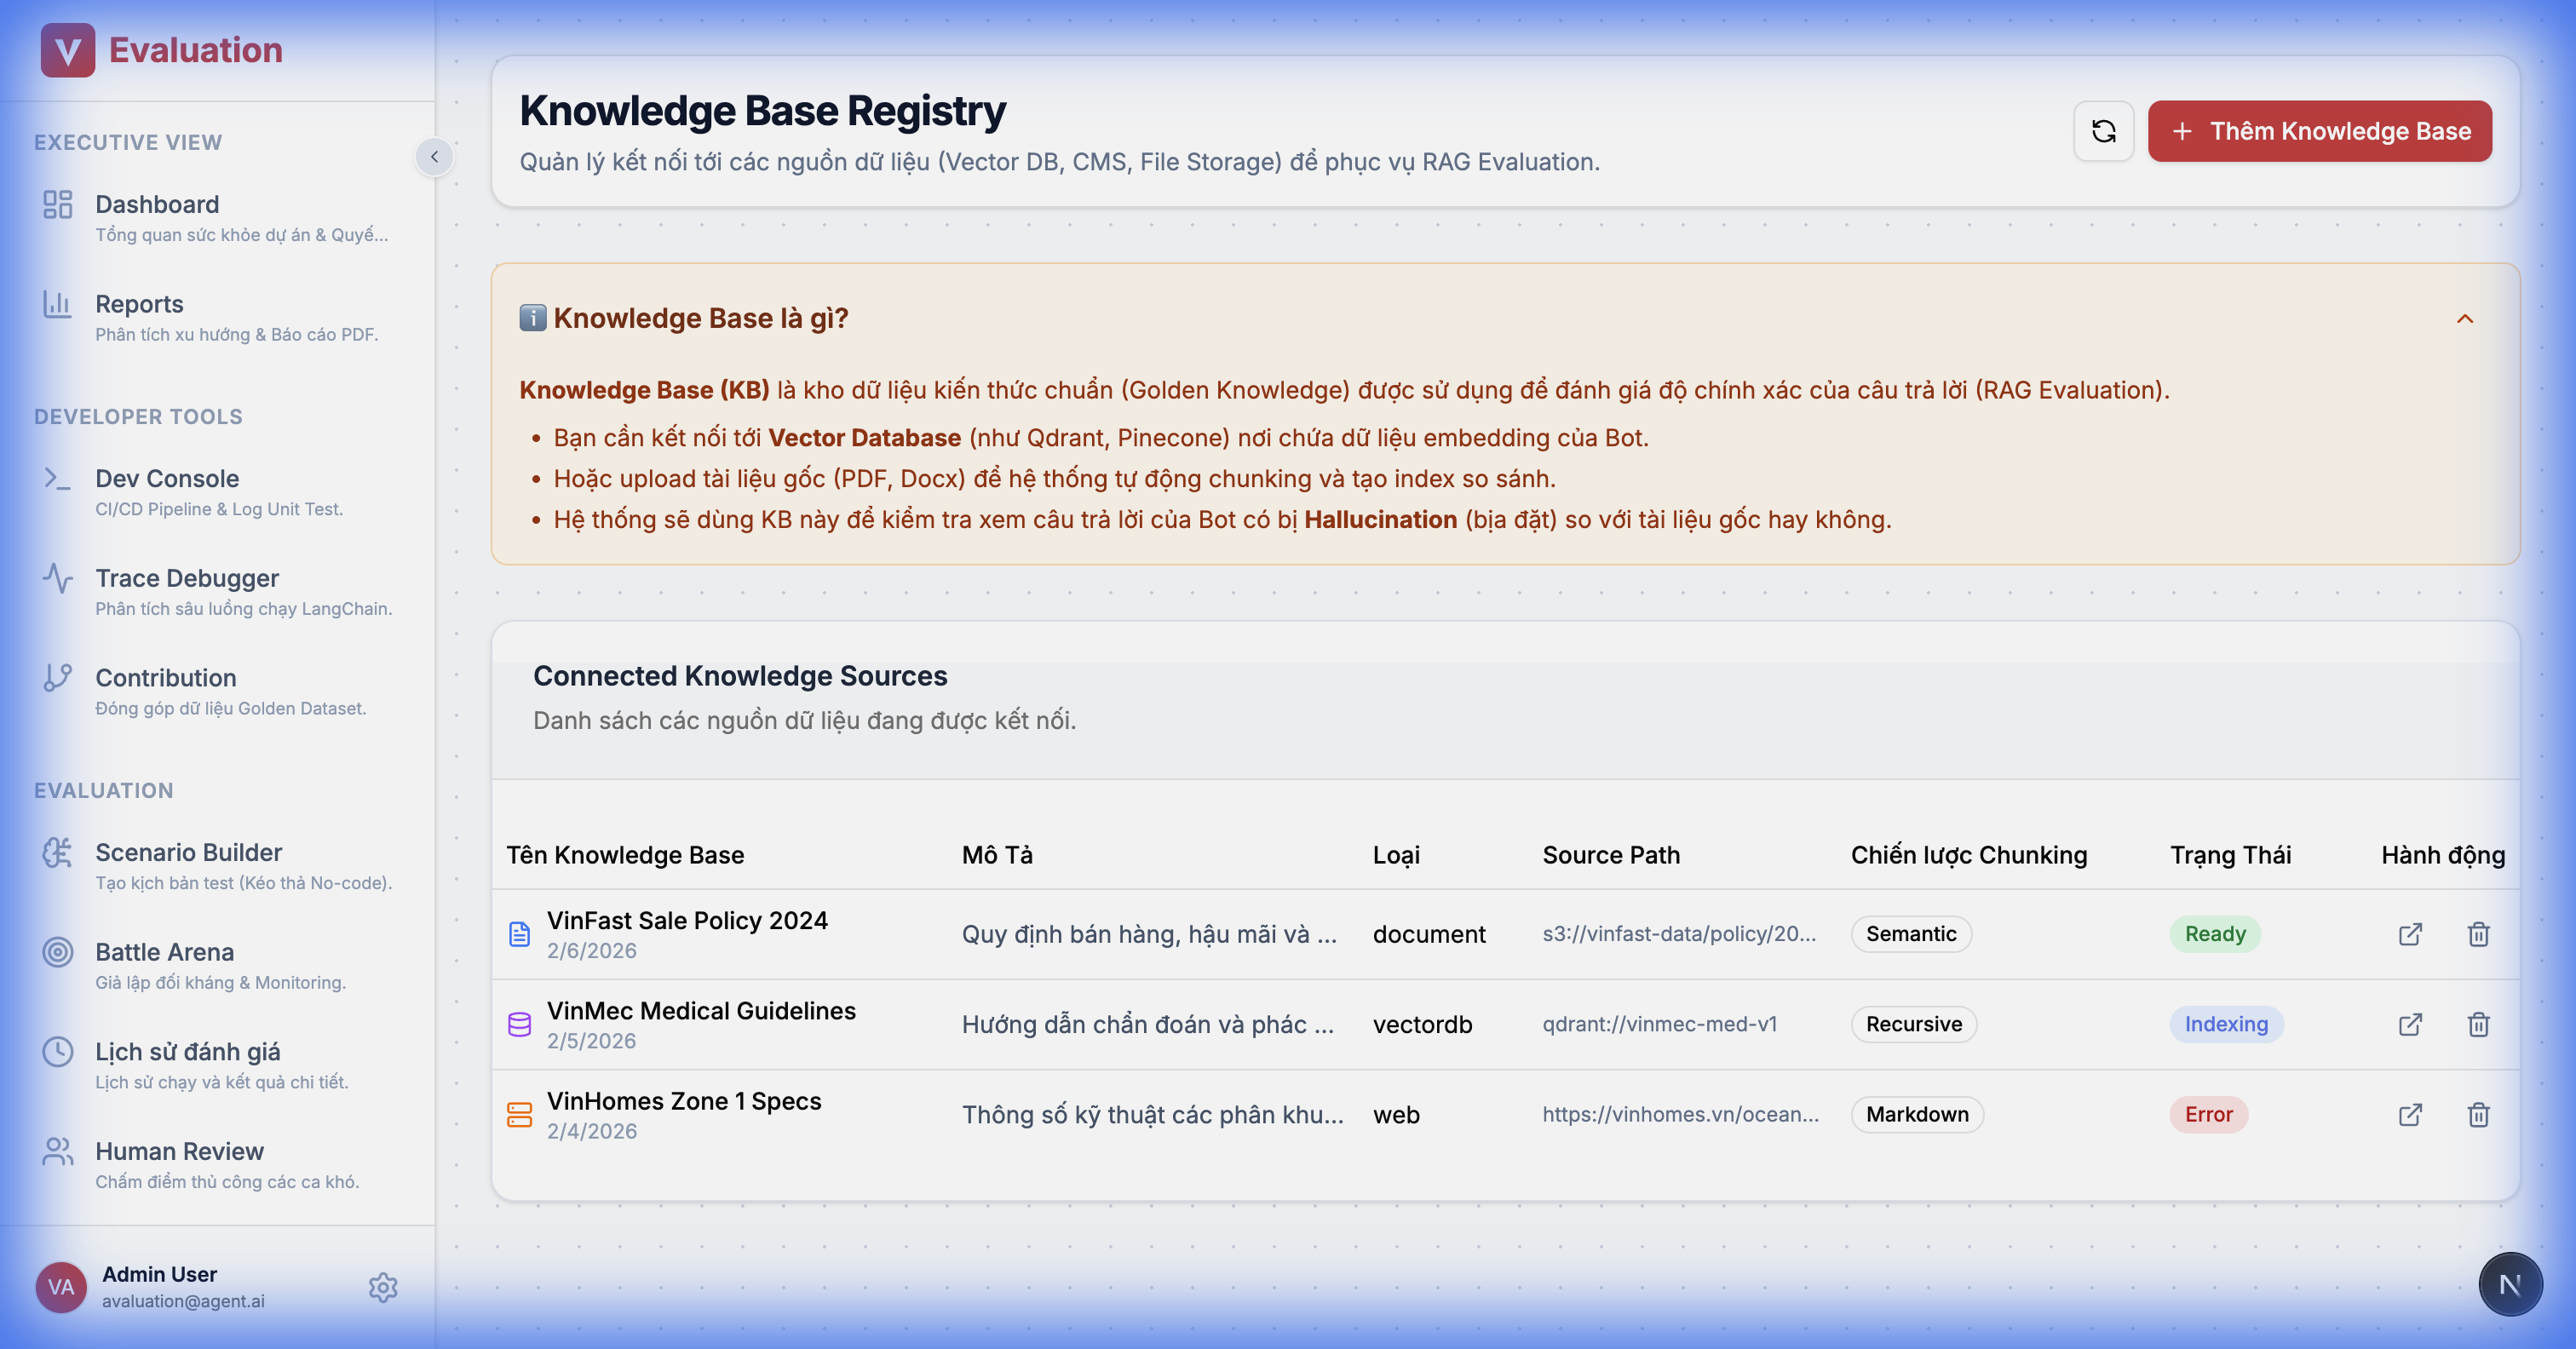
Details:
- Source Management: Upload documents (PDF) or connect to a Vector DB (Qdrant/Milvus).
- Status Tracking: Monitor Indexing/Embedding status.
2.16. Campaign Report Detail
Goal: Detailed reporting after a major test run.
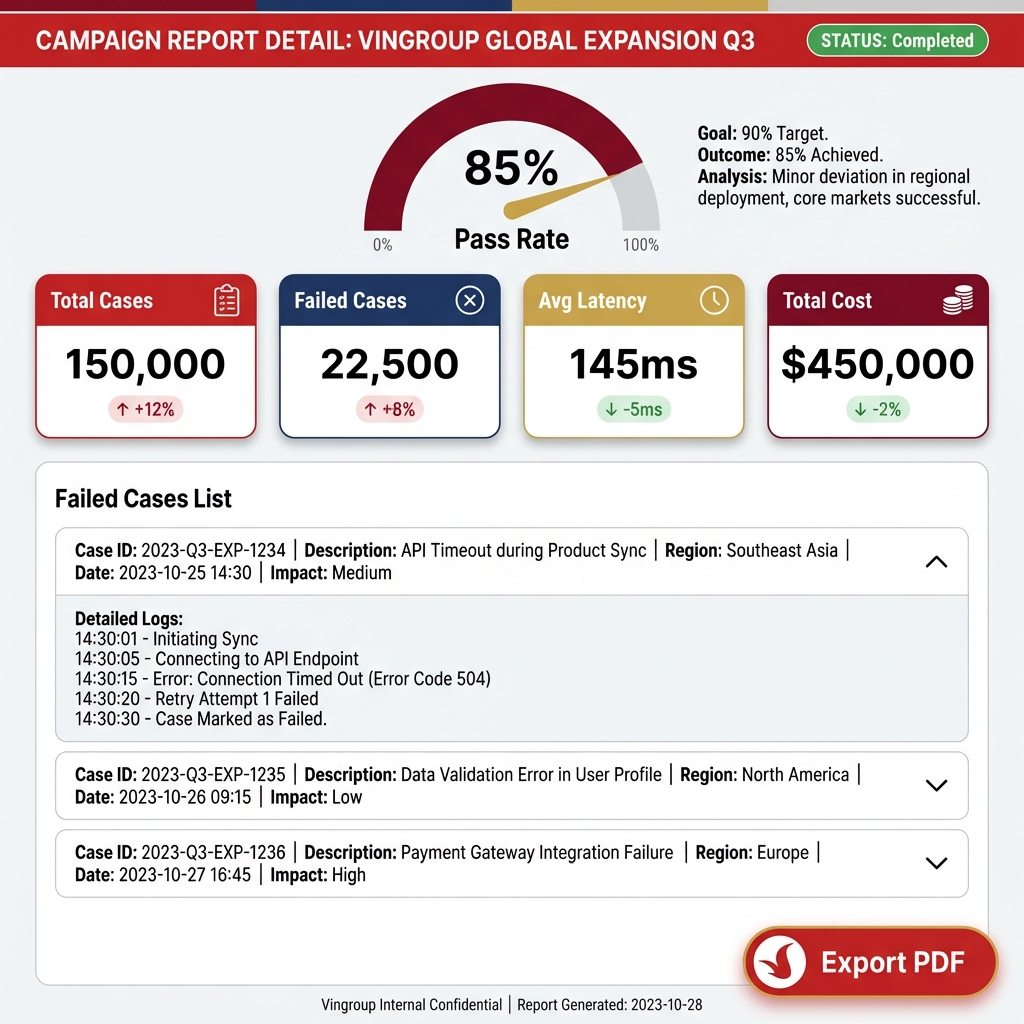
Key Metrics:
- Pass Rate Gauge: Gauge showing the pass rate (Target > 90%).
- Failed Cases List: Detailed list of failed cases with reasons (e.g., "Hallucination Detected").
- Export: Export report to standard PDF.
2.17. Advanced Reporting Suite
Goal: Provide multi-dimensional insights (Trend, RCA) instead of simple Pass/Fail reporting.
2.17.1. Trend Analysis (Regression View)
Goal: Answer "Is the bot getting smarter or dumber?"

Figma Design Spec:
- Trend Chart: Multi-axis Line Chart.
- Y1 Axis (Left): Score (Accuracy, Safety) - Scale 0-100%.
- Y2 Axis (Right): Latency (s) / Cost ($).
- Insight Panel: Right sidebar automatically highlights anomalies (Anomaly Detection). E.g., "Cost spiked by 20%".
2.17.2. Failure Clustering (Root Cause Analysis)
Goal: Answer "Why is the bot failing? Where is it failing the most?"

Figma Design Spec:
- Failure Clustering (RCA): Donut Chart or Treemap.
- Error categories: Hallucination, Safety, Timeout, Logic Loop.
- Drill-down: Clicking an error group (e.g., Hallucination) reveals a list of specific topics with the most errors (e.g., "Warranty Policy").
3. PROPOSED TECH STACK & INTEGRATION
Framework
- Frontend: Next.js 14 (App Router) + TypeScript.
- UI Library: Shadcn/UI (Based on Radix UI - Clean and highly customizable).
- Graph Library: ReactFlow (Industry standard for node-based editors).
Integration Strategy (Embed)
Instead of recoding the Trace View, we use Langfuse's Iframe Embed feature.
- Reduces frontend workload by ~40%.
4.2. Why ReactFlow?
- Proven Success: Used by LangFlow and Flowise.
- Customizability: Uses HTML tags inside nodes, allowing for easy embedding of forms, dropdowns, and buttons.